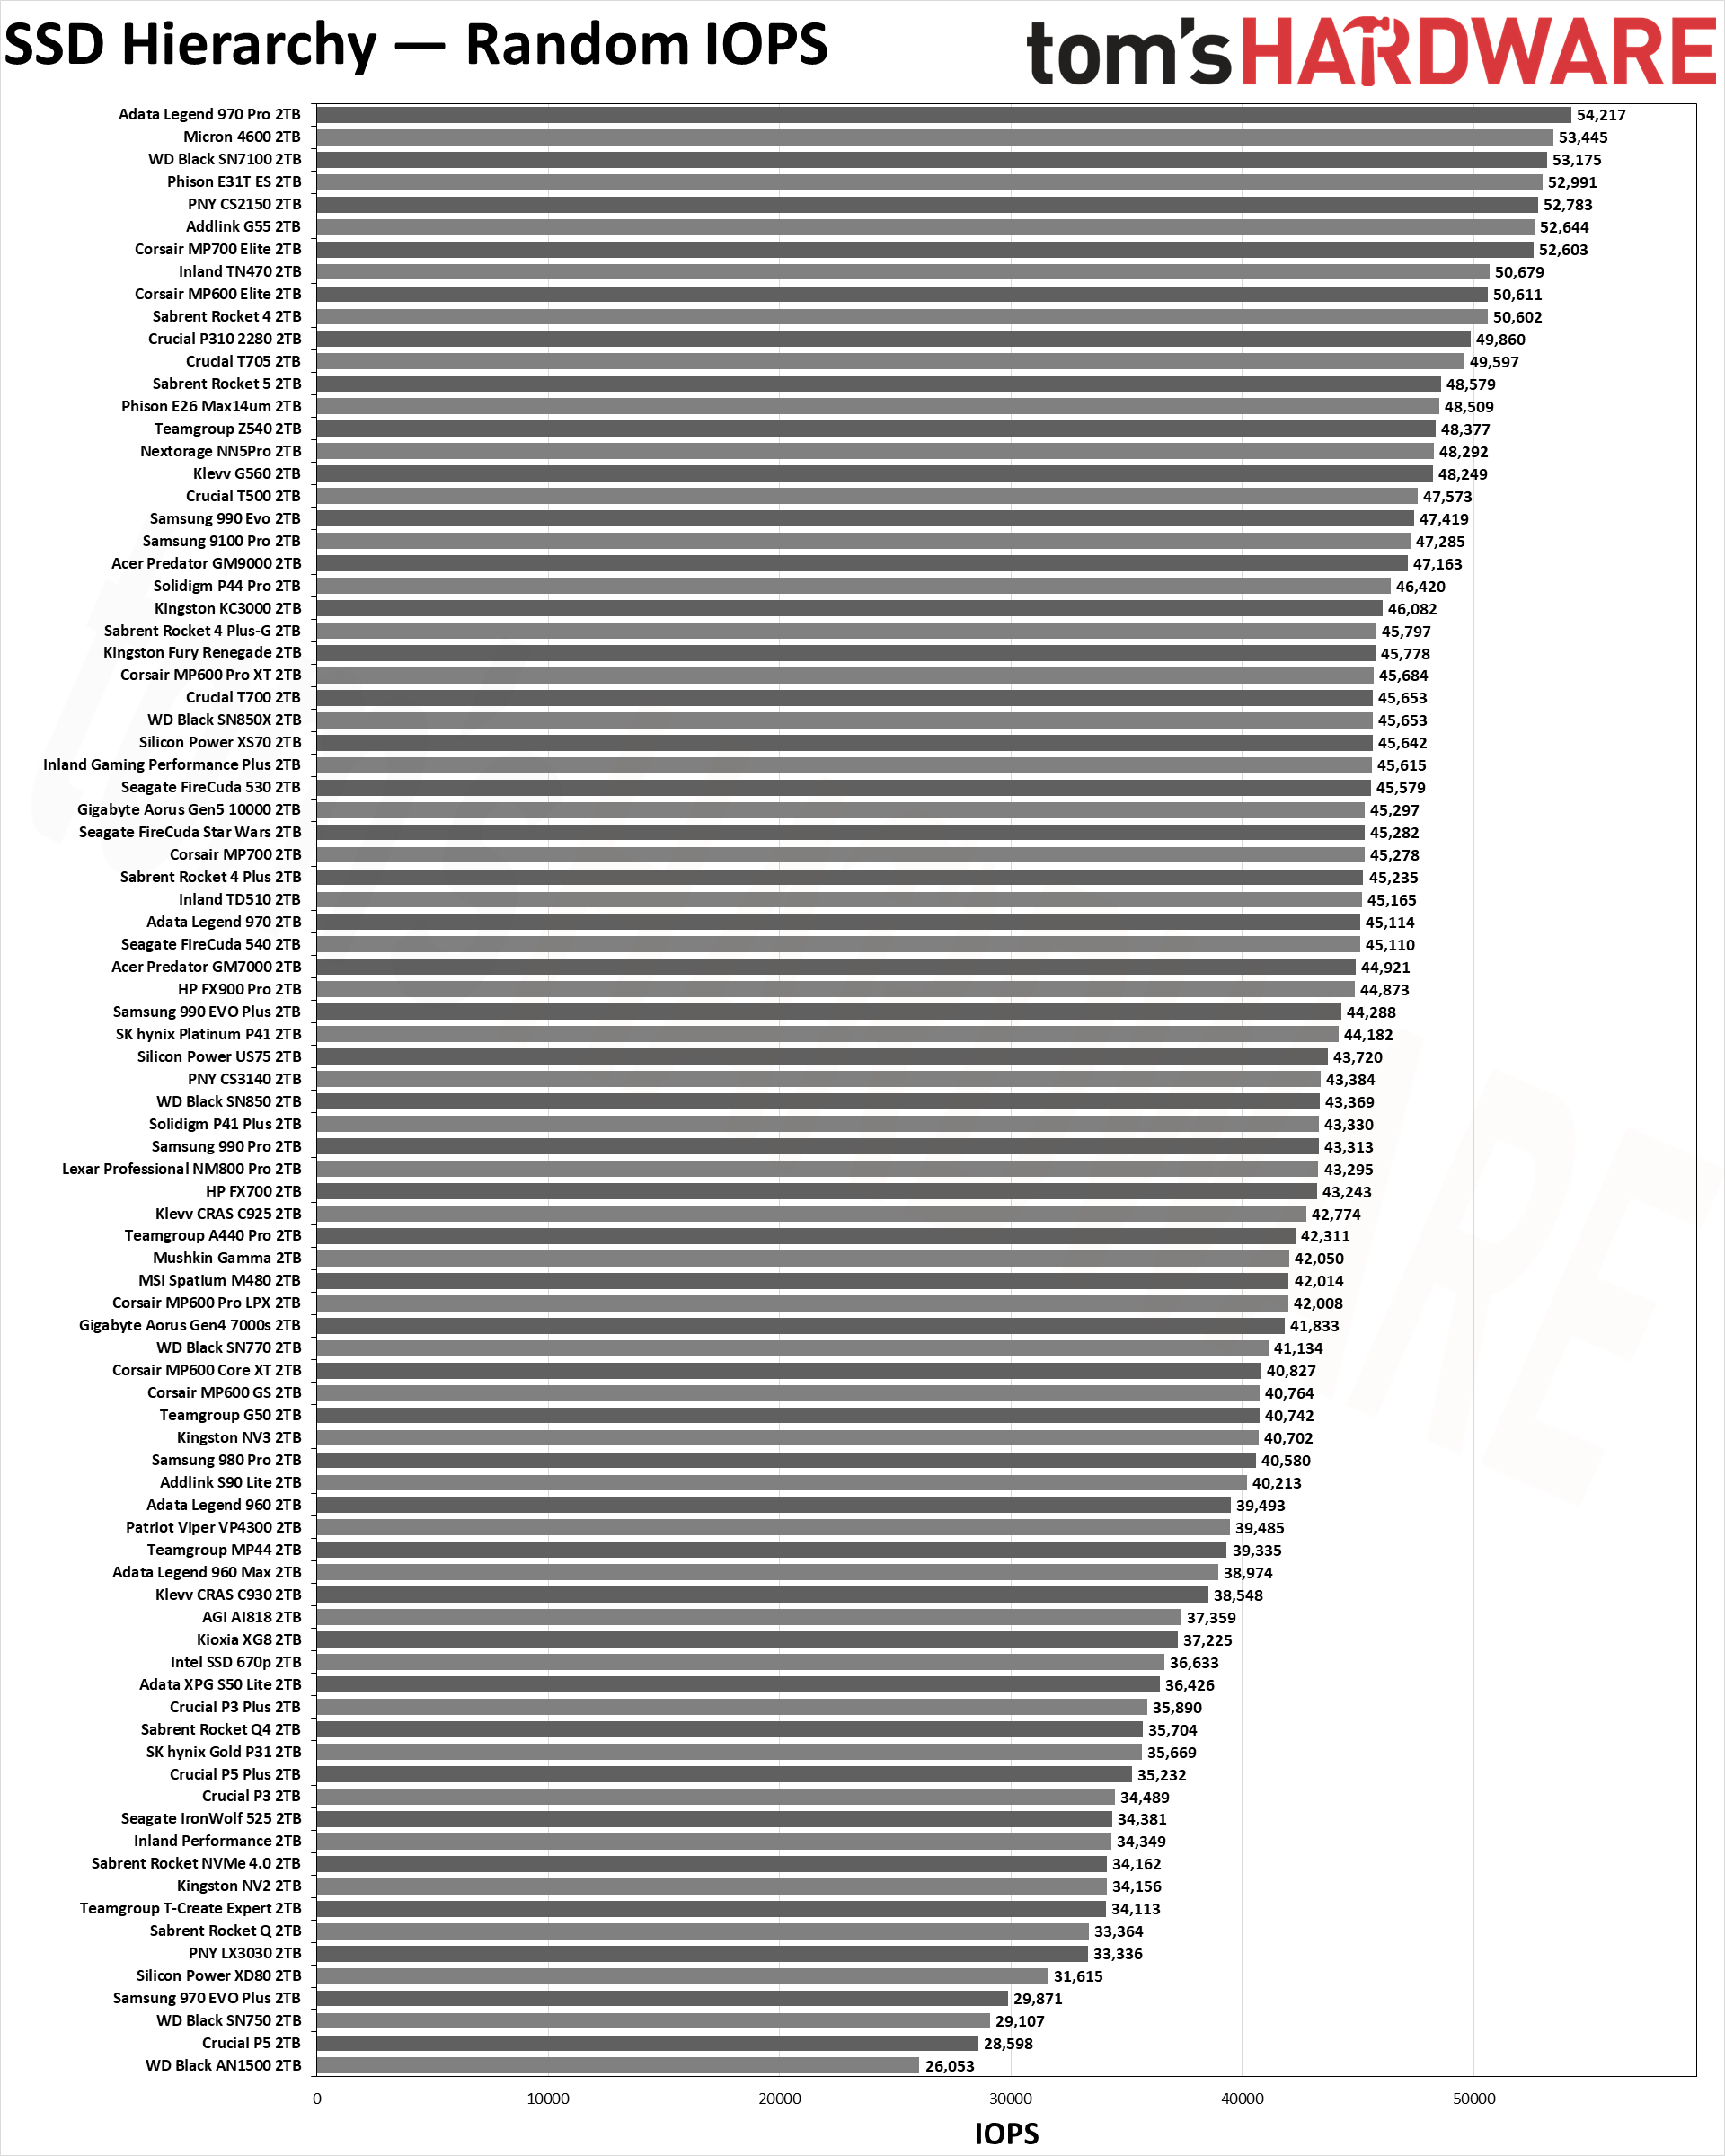
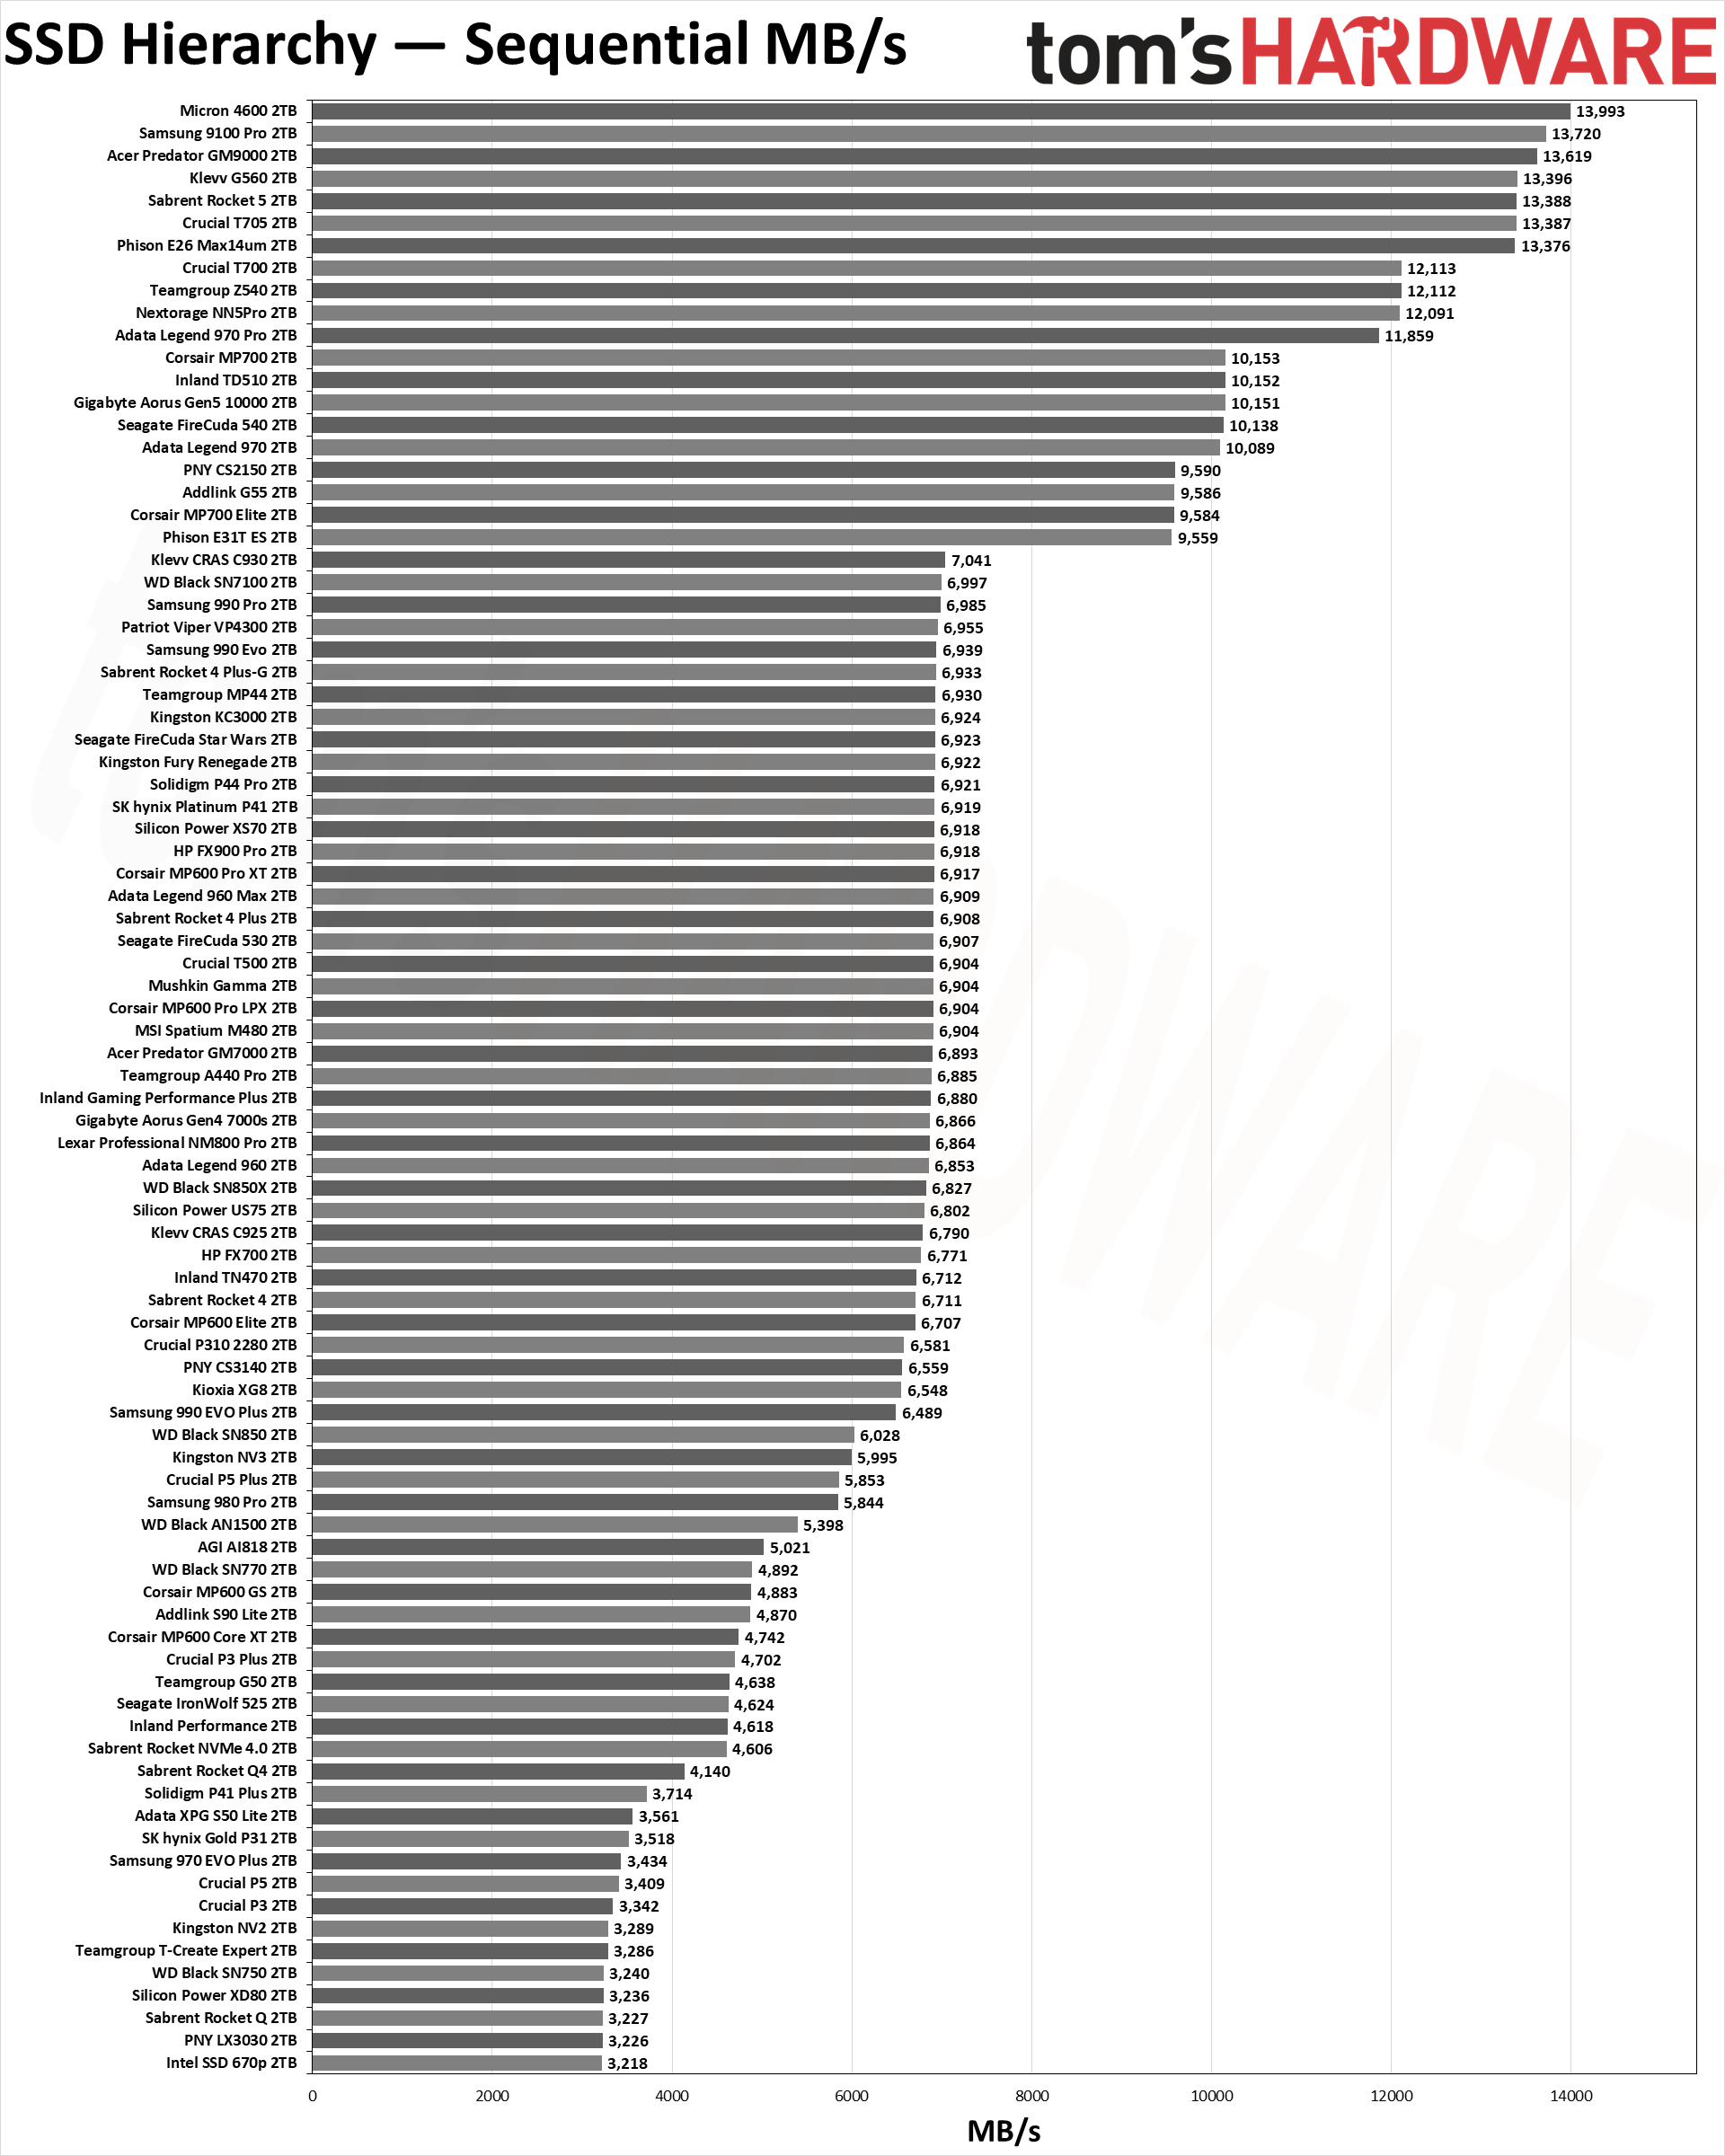
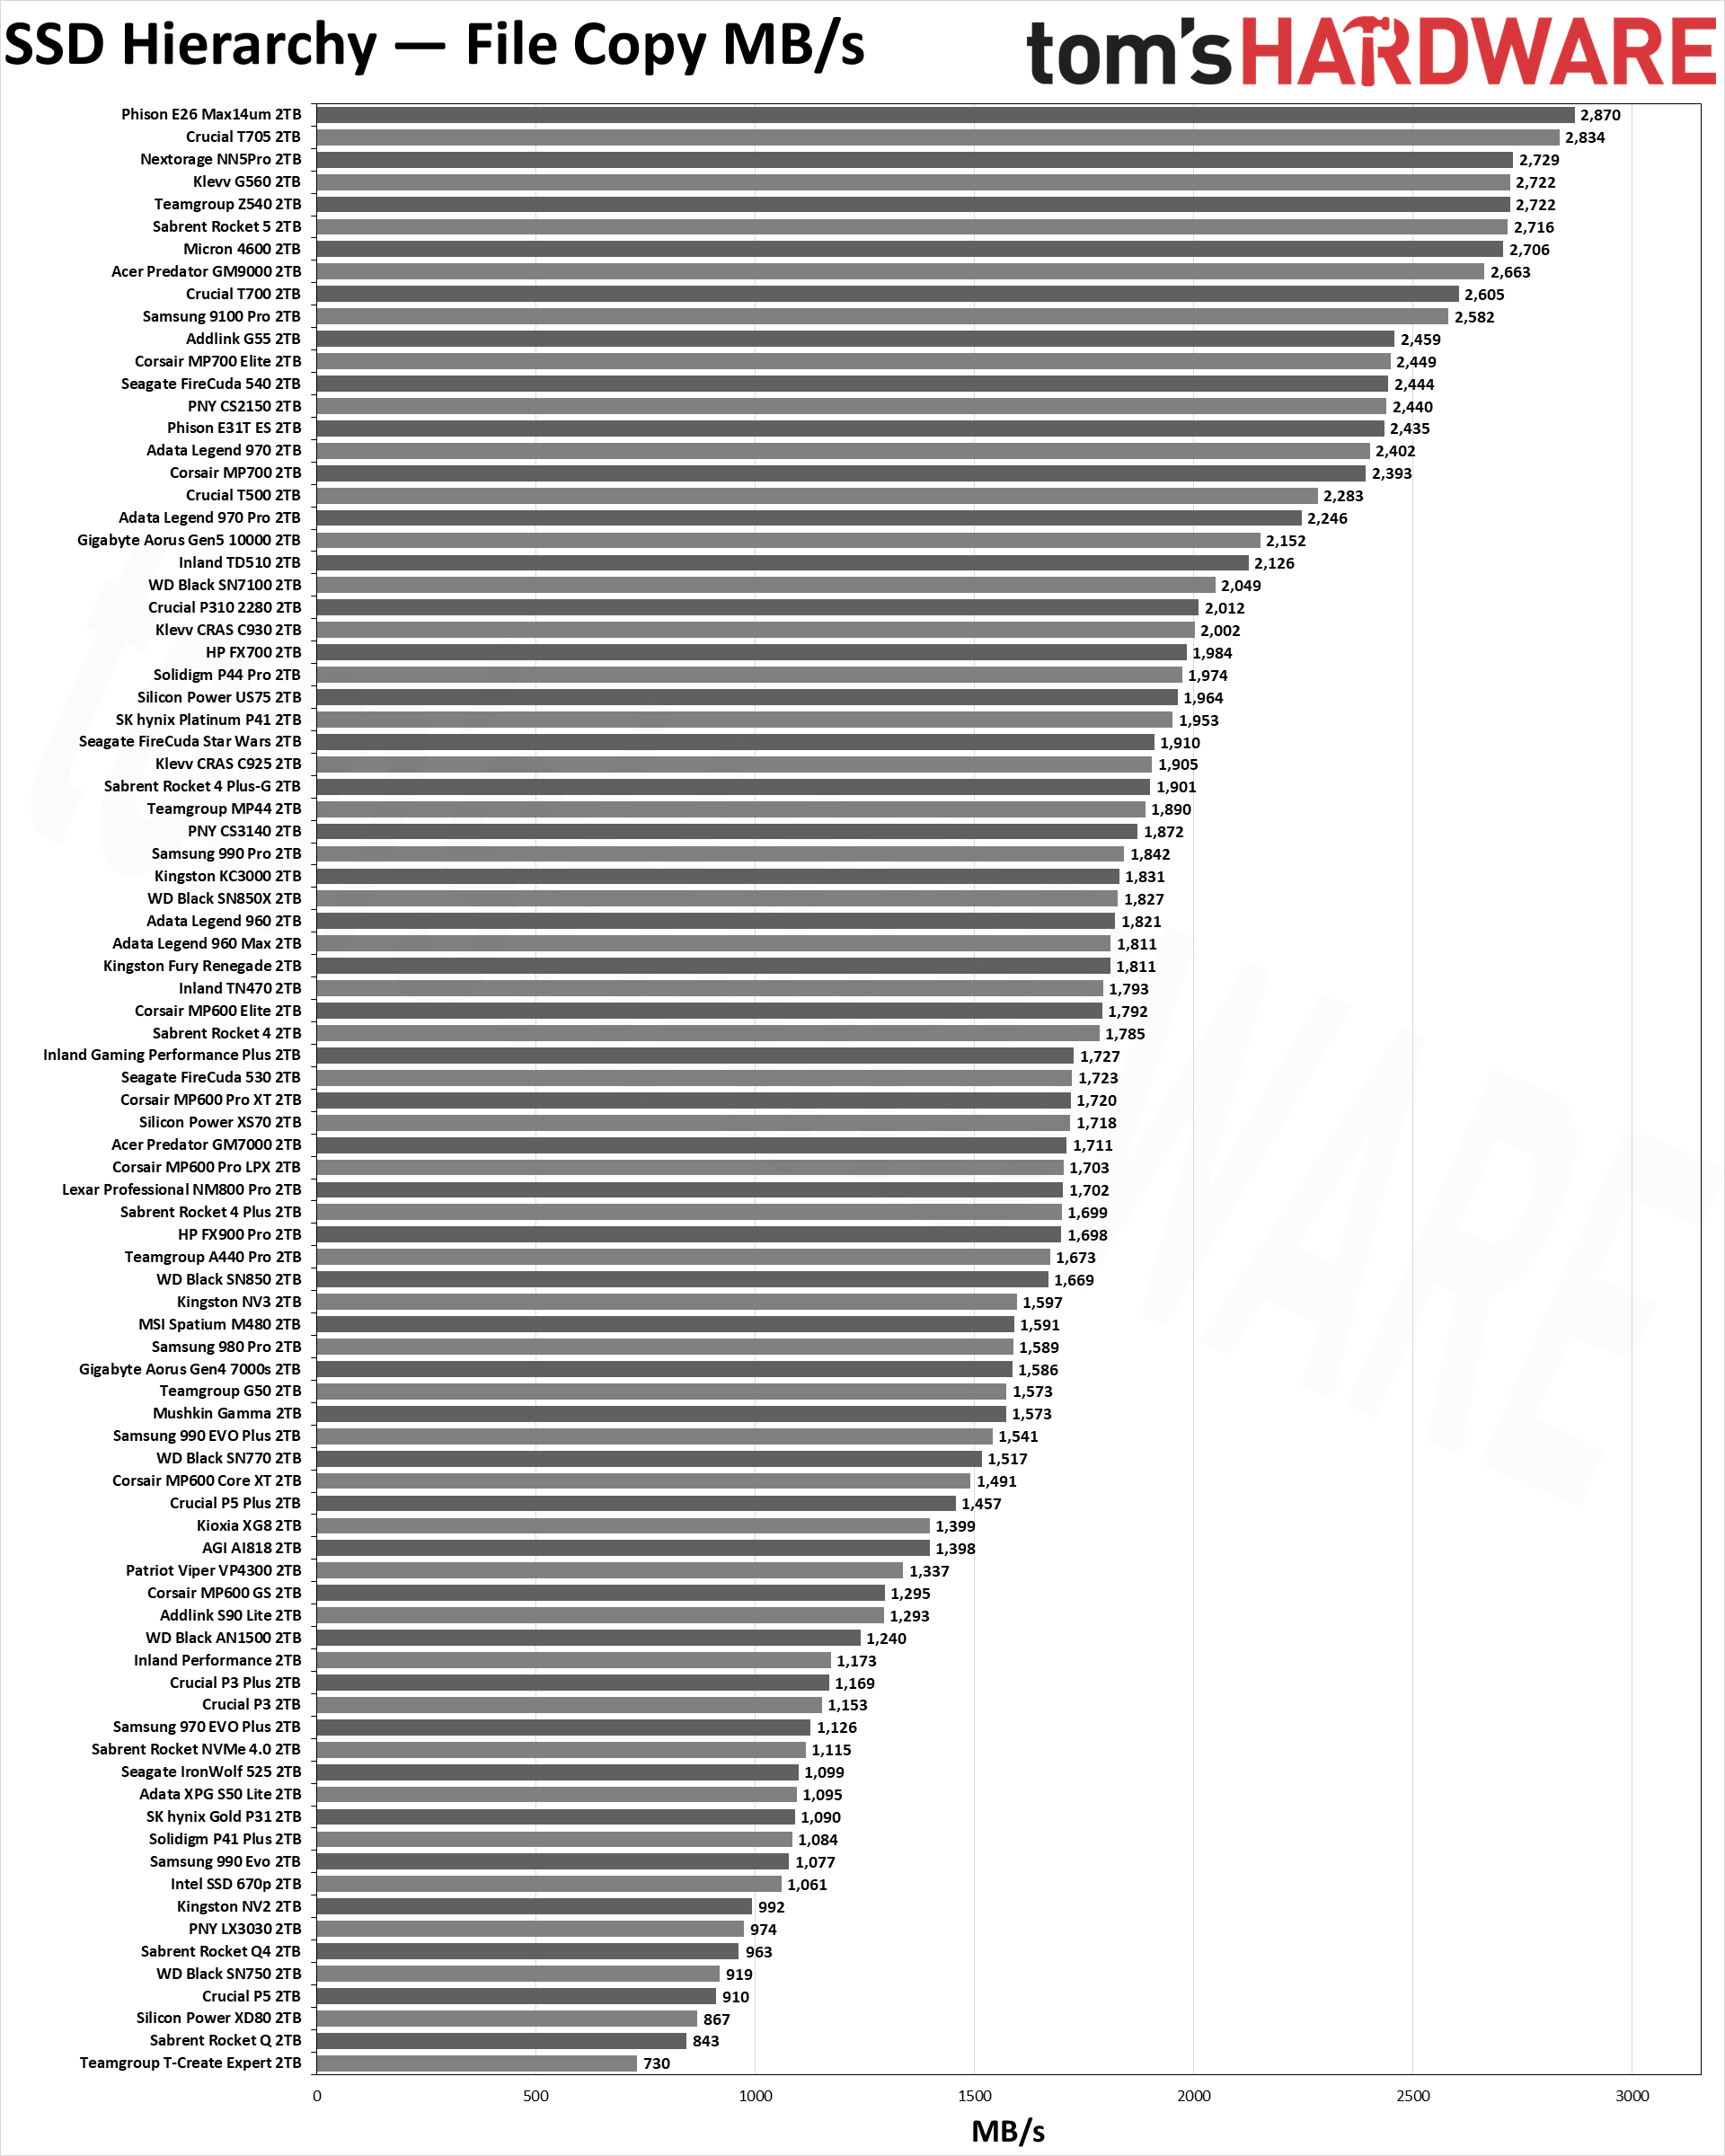
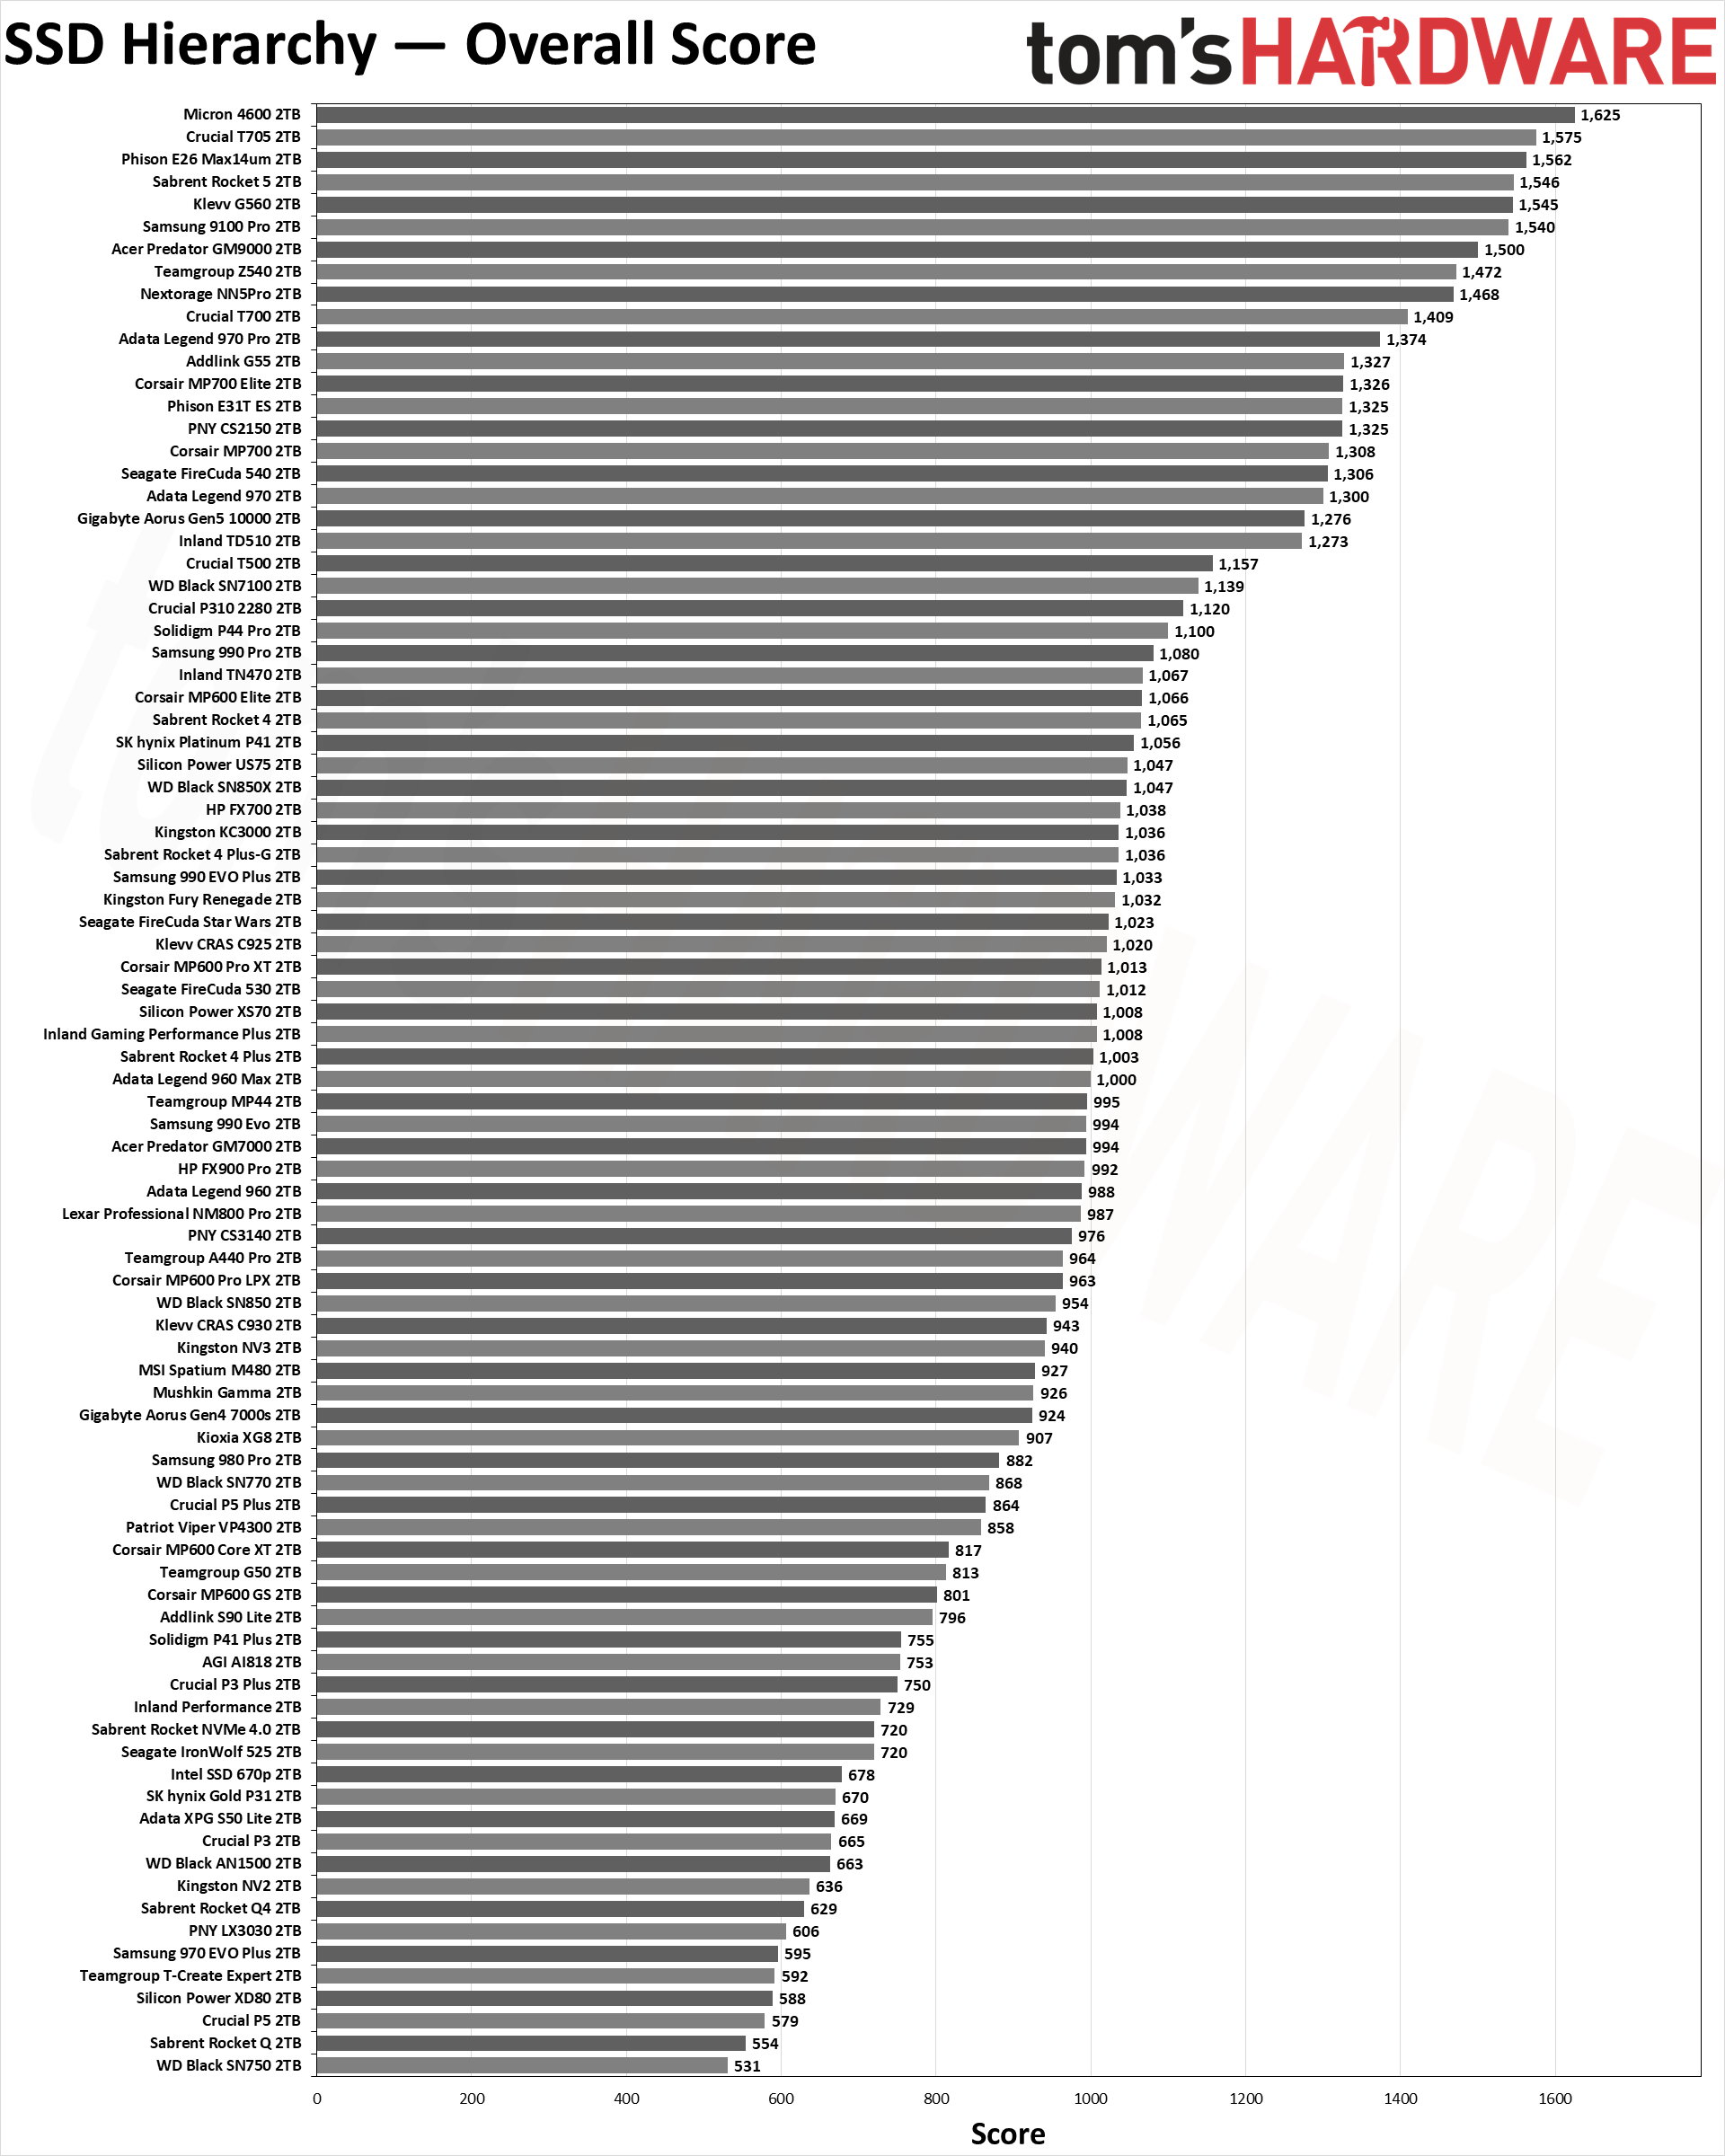
We’ve grouped the SSDs by capacity and type to help keep things simple. There are tables for 1TB, 2TB, and 4TB+ as well as charts below. We also have a separate chart for all the M.2 2230 drives — for the best Steam Deck SSDs and other handhelds. Given current prices, not to mention the voracious appetite for the capacity of modern games, we’re going to start with the 2TB drives. These are generally the sweet spot in price-to-performance and capacity ratios, though there’s still a wide range in price — we’re looking at you, PCIe 5.0 drives.
We’ve sorted by the random QD1 IOPS results for the tables — the geometric mean of both the read and write IOPS, to be precise. This is one of the more realistic representations of overall SSD performance, even if it’s a synthetic test, as it’s difficult to game the system. Lots of manufacturers will test random IO performance at queue depths of 32 or even 256 because that makes everything look much faster, but in the real world, random queue depths are mostly at QD1 and almost never go beyond QD4.
Besides 4K IOPS, our tables also show the sequential performance (the geomean of the QD8 sequential read and write tests), file copy bandwidth (for a 50GB folder copy with over 30,000 files), average power consumption while copying those files, and finally a look at the geometric mean of all the read/write bandwidth tests. All of these metrics are also broken out into separate charts, should you prefer that format.
We use the QD1 4K random results to quantify the snappiness and responsiveness of the SSD during a normal desktop PC experience. It should be immediately obvious that there’s not much difference between the various PCIe 3.0, 4.0, and 5.0 drives when it comes to QD1 random I/O. Yes, the Corsair MP600 Elite does take the top spot, barely, while second place goes to the Crucial T705 — the fastest SSD we’ve tested at present. Some of the other top-performing drives like the Crucial T500, Solidigm P44 Pro, and Kingston KC3000 are PCIe 4.0 drives, however.
Since we’re only using data from the past couple of years, after we switched to our current Core i9-12900K test PC, we’re decidedly heavy on PCIe 4.0 and 5.0 drives. But there are a decent number of PCIe 3.0 drives… near the bottom end of the table and charts. But even the fastest drives are less than twice the random I/O performance of the slowest drives.
That’s why we also include the other columns for performance. The pure sequential scores show maximum throughput, generally within most drives’ “burst” pSLC cache period. If you’re doing drive-to-drive copies or backups using PCIe 5.0 hardware, it can make a huge difference — the Phison E26 SSDs all sit at the top, significantly ahead of the fastest PCIe 4.0 drives, and you can also see the different in NAND speed when looking at the E26 drives. The T705 and Max14um have 14 GT/s NAND, several others use 12 GT/s NAND, and the earlier models are 10 GT/s.
Copy performance is more of a real-world look at a common task: Copying 50GB of data from the drive to itself. This requires simultaneous reads and writes, and even the fastest drives drop to under 3.0 GB/s, which is still about quadruple the performance of the slowest SSDs we’ve tested.
We noted last year that Black Friday / Cyber Monday was a great time to upgrade your SSD , and warned that prices could head north in the coming months. That has now proven to be the case, with many SSDs now selling for 20–30 percent more than what they cost last November. Where high-performance 2TB drives were previously starting at around $100, most now cost $120+. Samsung’s 990 Pro 2TB as another example dropped as far as $119 in November and now starts at $179, almost a 50% increase.
4TB and Larger SSD Hierarchy Swipe to scroll horizontally
SSD Random IOPS Seq MB/s Copy MB/s Avg. Power Overall Score Specifications Crucial T700 4TB 48,358 12,130 2,745 7.08 1,468 PCIe 5.0 x4, Phison E26, 232-Layer Micron TLC Samsung 9100 Pro 4TB 47,431 13,656 2,724 4.99 1,551 PCIe 5.0 x4, Samsung Presto, 236-Layer Samsung TLC (V8) Crucial T500 4TB 47,379 6,897 2,311 4.68 1,179 PCIe 4.0 x4, Phison E25, 232-Layer Micron TLC WD Blue SN5000 4TB 46,445 5,329 1,909 3.54 988 PCIe 4.0 x4, WD, 162-Layer Kioxia QLC Sabrent Rocket 4 Plus-G 4TB 45,849 7,004 1,824 5.04 1,034 PCIe 4.0 x4, Phison E18, 176-Layer Micron TLC Seagate FireCuda 530 4TB 45,580 6,896 1,706 4.99 1,009 PCIe 4.0 x4, Phison E18, 176-Layer Micron TLC Teamgroup A440 Pro Special 4TB 45,458 6,895 1,705 5.01 1,003 PCIe 4.0 x4, Phison E18, 176-Layer Micron TLC WD Black SN850X 8TB 45,437 6,835 2,052 4.37 1,070 PCIe 4.0 x4, WD, 162-Layer Kioxia TLC Sabrent Rocket 4 Plus 4TB 45,180 6,906 1,695 4.85 1,000 PCIe 4.0 x4, Phison E18, 96-Layer Micron TLC Patriot Viper VP4300 Lite 4TB 43,866 6,750 1,982 3.46 1,051 PCIe 4.0 x4, Maxio MAP1602, 232-Layer YMTC QLC Lexar Play 2280 4TB 43,604 6,847 1,945 3.56 1,040 PCIe 4.0 x4, Maxio MAP1602, 232-Layer YMTC QLC Netac NV7000 4TB 41,455 6,878 1,843 5.83 966 PCIe 4.0 x4, Phison E18, 176-Layer Micron TLC Samsung 990 Pro 4TB 40,678 7,013 1,910 4.54 1,063 PCIe 4.0 x4, Samsung Pascal, 236-Layer Samsung V-NAND TLC Lexar NM790 4TB 38,839 6,805 1,934 3.41 1,005 PCIe 4.0 x4, Maxio MAP1602, 232-Layer YMTC TLC Sabrent Rocket 4 Plus 8TB 38,828 6,537 1,527 5.66 881 PCIe 4.0 x4, Phison E18, 112-Layer Kioxia TLC Addlink A93 4TB 38,796 6,809 1,949 3.37 1,000 PCIe 4.0 x4, Maxio MAP1602, 232-Layer YMTC TLC Teamgroup Z44Q 4TB 35,872 4,437 1,111 4.49 671 PCIe 4.0 x4, Phison E16, 96-Layer Micron TLC Sabrent Rocket Q4 4TB 35,764 4,434 1,049 4.44 665 PCIe 4.0 x4, Phison E16, 96-Layer Micron QLC Sabrent Rocket Q 4TB 33,527 3,224 878 3.41 565 PCIe 3.0 x4, Phison E12S, 96-Layer Micron QLC Sabrent Rocket Q 8TB 33,511 3,217 894 4.03 564 PCIe 3.0 x4, Phison E12S, 96-Layer Micron QLC WD Red SN700 4TB 30,785 3,278 1,029 3.68 589 PCIe 3.0 x4, WD NVMe, 96-Layer Kioxia TLC
Image 1 of 4
(Image credit: Tom’s Hardware)
(Image credit: Tom’s Hardware)
(Image credit: Tom’s Hardware)
(Image credit: Tom’s Hardware)
Last up for standard SSDs, we have the 4TB and higher capacity drives. So far, we’ve only tested 15 such SSDs, though we expect more will arrive in our labs for testing over the coming year.
We’ve seen exactly one 4TB PCIe 5.0 drive so far, the Crucial T700 4TB , which is a beast of an SSD. It’s also beastly on pricing, currently selling for $473 (down from a $599 MSRP). If you want the faster T705 4TB, it’s $543 (but we haven’t tested the 4TB T705). We love the idea of large and fast performance, and prices are at least coming down now, but it’s still far more economical to pick up something like the Samsung 990 Pro 4TB for $339 .
Stepping up to 8TB drives usually means QLC NAND, and while that’s not the end of the world, there are often performance compromises. Not to mention, the 8TB SSDs still cost a pretty penny. The Sabrent Rocket 4 Plus 8TB costs $1,199 , while the Sabrent Rocket Q 8TB is “currently unavailable” on Amazon . It would be far cheaper to just pick up multiple 4TB drives rather than plunking down that much money for a single 8TB drive.
Sequential performance for most PCIe 4.0 SSDs lands right around 7 GB/s, with a couple of slower/older models at around 4.4 GB/s. The PCIe 3.0 drives all peak at just over 3.2 GB/s. File copy speeds are about one-third to one-fourth as fast, however.
1TB SSD Hierarchy Swipe to scroll horizontally
SSD Random IOPS Seq MB/s Copy MB/s Avg. Power Overall Score Specifications Inland TN470 1TB 50,551 6,583 1,776 3.27 1,054 PCIe 4.0 x4, Phison E27T, 162-Layer Kioxia TLC PNY CS3150 1TB 48,216 10,598 2,580 7.26 1,432 PCIe 5.0 x4, Phison E25, 232-Layer Micron TLC Gigabyte Aorus Gen5 12000 1TB 48,185 10,606 2,559 7.20 1,398 PCIe 5.0 x4, Phison E26, 232-Layer Micron TLC Seagate Game Drive PS5 1TB 47,967 6,447 1,903 4.31 1,037 PCIe 4.0 x4, Phison E18, 176-Layer Micron TLC Micron 3500 1TB 47,472 6,823 2,201 4.17 1,153 PCIe 4.0 x4, Phison E25, 232-Layer Micron TLC Silicon Motion SM2508A 1TB 47,467 13,483 2,618 4.98 1,528 PCIe 5.0 x4, Silicon Motion SM2508, 162-Layer Kioxia TLC Sabrent Rocket Nano 2242 1TB 47,145 5,033 1,488 2.85 882 PCIe 4.0 x4, Phison E27T, 162-Layer Kioxia TLC Solidigm P44 Pro 1TB 46,519 6,970 1,940 3.91 1,108 PCIe 4.0 x4, SK hynix Aries, 176-Layer SK hynix TLC Kingston KC3000 1TB 46,402 6,565 1,756 4.25 1,015 PCIe 4.0 x4, Phison E18, 176-Layer Micron TLC Sabrent Rocket 4 Plus-G 1TB 46,141 6,556 1,748 4.33 1,008 PCIe 4.0 x4, Phison E18, 176-Layer Micron TLC Kingston Fury Renegade 1TB 46,068 6,563 1,751 4.25 1,012 PCIe 4.0 x4, Phison E18, 176-Layer Micron TLC WD Black SN850 1TB 45,709 6,059 1,697 3.79 980 PCIe 4.0 x4, WD_Black G2, 96-Layer Kioxia TLC PNY CS3140 1TB 45,656 6,428 1,678 4.16 983 PCIe 4.0 x4, Phison E18, 176-Layer Micron TLC Sabrent Rocket 4 Plus 1TB 45,422 6,435 1,655 4.15 978 PCIe 4.0 x4, Phison E18, 96-Layer Micron TLC WD Black SN850X 1TB 45,325 6,671 1,726 3.79 1,026 PCIe 4.0 x4, WD_Black G2, 112-Layer Kioxia TLC Nextorage NE5N 1TB 45,251 9,220 2,278 6.80 1,246 PCIe 5.0 x4, Phison E26, 232-Layer Micron TLC WD Black SN770 1TB 44,712 5,105 1,580 3.29 926 PCIe 4.0 x4, WD NVMe, 112-Layer Kioxia TLC HP FX900 1TB 44,472 4,951 1,401 2.59 821 PCIe 4.0 x4, InnoGrit IG5220, 176-Layer Micron TLC Patriot P400 1TB 44,311 4,922 1,276 3.25 804 PCIe 4.0 x4, InnoGrit IG5220, 176-Layer Micron TLC SK hynix Platinum P41 1TB 44,282 6,849 1,884 3.80 1,051 PCIe 4.0 x4, SK hynix Aries, 176-Layer SK hynix TLC Netac NV7000-Q 1TB 43,973 6,620 1,808 2.68 1,013 PCIe 4.0 x4, Maxio MAP1602, 232-Layer YMTC QLC Solidigm P41 Plus 1TB 42,911 3,507 1,030 2.72 733 PCIe 4.0 x4, Silicon Motion SM2269XT, 144-Layer Solidigm QLC Corsair MP600 Pro 1TB 42,386 6,217 1,475 4.20 889 PCIe 4.0 x4, Phison E18, 96-Layer Micron TLC Gigabyte Aorus Gen4 7000s 1TB 42,187 6,168 1,463 4.20 884 PCIe 4.0 x4, Phison E18, 96-Layer Micron TLC WD Blue SN580 1TB 42,097 4,174 1,501 3.54 836 PCIe 4.0 x4, WD, 112-Layer Kioxia TLC Patriot Viper VPR400 1TB 41,929 4,975 1,417 4.02 792 PCIe 4.0 x4, InnoGrit IG5220, 176-Layer Micron TLC Samsung 980 Pro 1TB 41,636 5,834 1,638 3.70 900 PCIe 4.0 x4, Samsung Elpis, 1xx-Layer Samsung V-NAND TLC Silicon Power UD90 1TB 40,848 4,851 1,214 2.50 807 PCIe 4.0 x4, Phison E21T, 176-Layer Micron TLC Teamgroup MP44L 1TB 40,530 4,835 1,303 2.58 811 PCIe 4.0 x4, Phison E21T, 176-Layer Micron TLC Adata Legend 960 1TB 39,780 6,745 1,613 3.89 965 PCIe 4.0 x4, Silicon Motion SM2264, 176-Layer Micron TLC Acer Predator GM7 1TB 39,414 6,695 1,689 2.63 960 PCIe 4.0 x4, Maxio MAP1602, 128-Layer YMTC TLC SK hynix Gold P31 1TB 38,521 3,511 1,056 2.38 688 PCIe 3.0 x4, SK hynix Cepheus, 128-Layer SK hynix TLC Sabrent Rocket Q4 1TB 35,787 3,079 741 3.80 542 PCIe 4.0 x4, Phison E16, 96-Layer Micron QLC Crucial P5 Plus 1TB 35,346 5,827 1,426 4.20 858 PCIe 4.0 x4, Crucial NVMe, 176-Layer Micron TLC Inland Prime 1TB 35,248 3,023 733 2.54 563 PCIe 3.0 x4, Phison E15T, 176-Layer Micron TLC Acer Predator GM3500 1TB 34,597 3,310 877 3.36 629 PCIe 3.0 x4, Silicon Motion SM2262EN, 96-Layer Micron TLC MSI Spatium M470 1TB 34,505 4,614 1,102 4.48 725 PCIe 4.0 x4, Phison E16, 96-Layer Kioxia TLC Sabrent Rocket NVMe 4.0 1TB 34,456 4,615 1,102 4.56 727 PCIe 4.0 x4, Phison E16, 96-Layer Kioxia TLC Transcend 250H 1TB 34,378 6,640 1,697 5.47 900 PCIe 4.0 x4, Silicon Motion SM2264, 112-Layer Kioxia TLC Kingston NV2 1TB 34,277 3,197 1,039 3.83 634 PCIe 4.0 x4, Variable, Variable WD Black SN750 SE 1TB 34,031 3,193 1,012 3.34 614 PCIe 4.0 x4, Phison E19T, 96-Layer Kioxia TLC Seagate FireCuda 510 1TB 33,799 2,637 577 3.34 445 PCIe 3.0 x4, Phison E12S, 64-Layer Kioxia TLC Sabrent Rocket Q 1TB 33,585 2,592 681 2.99 489 PCIe 3.0 x4, Phison E12S, 96-Layer Micron QLC WD Black SN750 1TB 32,795 3,251 914 3.69 568 PCIe 3.0 x4, WD NVMe, 64-Layer SanDisk TLC Samsung 980 1TB 32,672 3,168 982 3.45 645 PCIe 3.0 x4, Samsung Pablo, 128-Layer Samsung V-NAND TLC WD Blue SN570 1TB 32,007 3,390 589 3.11 575 PCIe 3.0 x4, WD, 112-Layer Kioxia TLC Samsung 970 EVO Plus 1TB 31,181 3,424 1,088 4.51 608 PCIe 3.0 x4, Samsung Phoenix, 9x-Layer Samsung V-NAND TLC Crucial P5 1TB 28,666 3,430 893 3.99 577 PCIe 3.0 x4, Crucial NVMe, 96-Layer Micron TLC Addlink D60 1TB 21,170 3,342 934 6.62 558 PCIe 4.0 x4, Phison E18, 112-Layer Kioxia TLC
Image 1 of 4
(Image credit: Tom’s Hardware)
(Image credit: Tom’s Hardware)
(Image credit: Tom’s Hardware)
(Image credit: Tom’s Hardware)
The 1TB SSDs mostly mirror what we’ve already seen with the 2TB drives. However, in more extensive testing (like our write saturation tests), the lower capacity means you’ll run out of pSLC cache more quickly. There are of course exceptions, like Intel’s Optane SSDs that provide incredible QD1 random IO. RIP, 3D XPoint… RIP.
Aside from the Optane drives, the Gigabyte Gen5 12000 sits at the top of all four charts, with a sizeable lead on the sequential performance metric. The Nextorage NE5N is the only other 1TB PCIe 5.0 drive that we’ve tested, but it comes with slower NAND and thus falls behind in some of the other tests.
The random performance again gives a great illustration of why so many people might think that faster SSDs don’t really make that much of a difference. QD1 is the most likely scenario for random workloads, and even the fastest SSD is only about 70% faster than the slowest SSD in our group. But sequential performance does matter, even for things as simple as verifying a game installation in Steam. The top performers are up to four times as fast as the slowest drives in that case.
The copy results level the playing field. Many of the SSDs will use the same controller and same NAND, which is why there are a lot of SSDs that deliver roughly the same performance. They won’t be the same in every instance, but for moderate use, just about any of these SSDs will still perform competently, in which case, looking for a good deal is often the determining factor.
You can now find even quality 1TB drives for well under $100. The least expensive 1TB SSD that we’ve tested right now is the HP FX900 at $65 , which provides a good blend of performance overall. Faster drives like the WD Black SN850X 1TB now cost $89, making them less enticing. The cheapest drives cost $5–$10 less, but they’re often slower, use QLC NAND, and/or have some other potential concerns.
M.2 2230 SSD Hierarchy Swipe to scroll horizontally
SSD Random IOPS Seq MB/s Copy MB/s Avg. Power Overall Score Specifications Nextorage NN4ME 2TB (2230) 50,915 6,589 1,767 3.27 1,052 PCIe 4.0 x4, Phison E27T, 162-Layer Kioxia TLC Corsair MP600 Mini E27T 1TB (2230) 50,585 6,583 1,754 3.35 1,052 PCIe 4.0 x4, Phison E27T, 162-Layer Kioxia TLC Crucial P310 2TB (2230) 49,928 6,573 2,019 3.50 1,122 PCIe 4.0 x4, Phison E27T, 232-Layer Micron QLC Corsair MP600 Core Mini 2TB (2230) 43,589 4,485 1,446 2.70 823 PCIe 4.0 x4, Phison E21T, 176-Layer Micron QLC Patriot Viper VP4000 Mini 2TB (2230) 43,578 4,504 1,447 2.70 828 PCIe 4.0 x4, Phison E21T, 232-Layer Micron QLC Silicon Power UD90 2TB (2230) 43,480 4,502 1,441 2.72 826 PCIe 4.0 x4, Phison E21T, 176-Layer Micron QLC Lexar Play 1TB (2230) 42,980 4,989 1,477 2.75 894 PCIe 4.0 x4, Silicon Motion SM2269XT, 176-Layer Micron TLC Teamgroup MP44S 1TB (2230) 41,171 4,387 1,348 2.51 785 PCIe 4.0 x4, Phison E21T, 176-Layer Micron QLC Inland QN446 2TB (2230) 41,076 4,485 1,411 2.75 795 PCIe 4.0 x4, Phison E21T, 176-Layer Micron QLC Sabrent Rocket Q4 2TB (2230) 40,958 4,493 1,374 2.57 795 PCIe 4.0 x4, Phison E21T, 176-Layer Micron QLC WD SN740 2TB (2230) 40,912 5,067 1,513 3.65 890 PCIe 4.0 x4, WD NVMe, 112-Layer Kioxia TLC Addlink S91 2TB (2230) 40,685 4,491 1,372 2.36 793 PCIe 4.0 x4, Phison E21T, 176-Layer Micron QLC WD Black SN770M 2TB (2230) 40,601 5,070 1,523 3.83 890 PCIe 4.0 x4, WD NVMe, 112-Layer Kioxia TLC Corsair MP600 Mini 1TB (2230) 40,320 4,818 1,529 2.58 814 PCIe 4.0 x4, Phison E21T, 176-Layer Micron TLC Inland TN446 1TB (2230) 40,303 4,840 1,516 2.66 815 PCIe 4.0 x4, Phison E21T, 176-Layer Micron TLC Sabrent Rocket 4 1TB (2230) 40,153 4,846 1,525 2.58 814 PCIe 4.0 x4, Phison E21T, 176-Layer Micron TLC Inland TN436 1TB (2230) 32,349 3,000 1,090 3.59 605 PCIe 4.0 x4, Phison E19T, 112-Layer Kioxia TLC
Image 1 of 4
(Image credit: Tom’s Hardware)
(Image credit: Tom’s Hardware)
(Image credit: Tom’s Hardware)
(Image credit: Tom’s Hardware)
Wrapping things up, nearly all of the drives in the previous lists have been 2280 models — 22mm wide and 80mm long. M.2 2230 SSDs are becoming popular, thanks in part to the rise of the Steam Deck and other handheld gaming portables. We’ve tested a baker’s dozen of the 2230 SSDs, and nearly all of the drives use the same hardware, resulting in very similar performance. There are only two exceptions: the WD Black SN770M and SN740 use a custom WD controller, while the Inland TN436 uses an older Phison E18T controller — everything else uses the Phison E21T controller.
A few of the drives scored better in our random IO tests, but it was consistently faster than other 2230 drives, likely thanks to newer firmware. The TN436 ends up dead last, as expected, while everything else falls within a relatively narrow range of 40K–41K IOPS.
The WD Black SN770M and WD SN740 (an OEM variant of the same hardware, more or less) take the top spots in the sequential performance tests. At the same time, the controller gets hotter than other drives, which can be a potential concern for using it in the Steam Deck. The new Lexar Play 1TB also performed ahead of the crowd, followed by the other 1TB TLC drives, with the QLC-equipped drives filling out the chart.
The biggest issue with M.2 2230 drives is their pricing. The 1TB models are at least reasonably competitive, with the Corsair MP600 Mini going for $84 , but the 2TB drives generally cost over twice as much. It’s the price for going ultra-compact, and if you’re just looking for the least expensive 2TB drive you can find the Addlink S91 2TB costs $178 — a reasonable choice for the Steam Deck. The absolute cheapest 2TB M.2 2230 drive currently available is the Micron 2400 at $156 , which we haven’t reviewed; it uses the SM2269XT controller and QLC NAND, so it will likely be a bit slower than the Phison E21T models.
The 2230 drives are very much not about maximum performance. Most 2TB models use QLC NAND, and under sustained write saturation testing, they’ll drop below 100 MB/s. But that’s the thing: A Steam Deck can’t even write at 100 MB/s if you’re downloading games over its wireless connection. We typically saw peak data rates of ~30 MB/s is all. So, picking up the most cost-effective 2230 drive for such use makes sense.


